Imagine juggling several balls at once, keeping your eyes on all of them. To drop one is to spoil the entire performance. In order to accomplish this, you must be a skilled juggler. A project manager’s job is like this, keeping all the parts of the moving project working and going forward.
But there is a wonderful tool that help with the juggling – the Gantt Chart. Even though Henry Gantt invented it in 1910, it is relevant and extremely useful today, especially with all the Gantt Chart software.
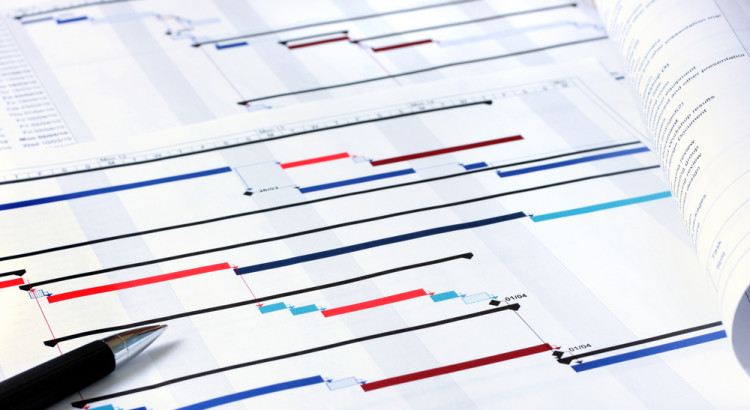
Patrick Hankinson of Hello Focus explains:
Put simply, a Gantt Chart is a way to visualize a project schedule. At first glance a Gantt Chart might not look substantially different from a horizontal bar chart. However, by plotting progress (either completed or expected) against project elements, Gantt Charts create a visual timeline that is coherent and easy to interpret.
Reasons to Use a Gantt Chart:
- You can have a chart that is visual and flexible. The chart will be an evolving document that can tell you and your team the exact progress you’re making on individual aspects of the project and the project as a whole.
- You can manage jobs effectively. By using a Gantt Chart, you can break the project down into manageable tasks. It all boils down to manageability. Gantt Charts help you break down big projects into small chunks so that tasks can be delegated and responsibilities shared. As part of this process, you’ll work out who will be responsible for each task, how long each task will take, and what problems your team may encounter. This detailed thinking helps you ensure that the schedule is workable, the right people are assigned to each task, and that you have workarounds for potential problems before you start.
- You can set accurate deadlines. Make it a habit to schedule or reschedule tasks for a project directly on your Gantt Chart. By doing so, you’ll see how every tiny change affects the timing of the entire project — which means more precise planning and accurate deadlines.
- You can define dependencies. One of the best reasons to use a Gantt Chart is to determine out the total amount of time it will take to accomplish a project (what project managers like to call the Critical Path). This can be done by defining dependencies — those tasks which depend on other tasks before they can be started or completed.
According to the editorial team and Mind Tools:
In Gantt charts, there are three main relationships between sequential tasks:
Finish to Start (FS) – FS tasks can’t start before a previous (and related) task is finished. However, they can start later. Start to Start (SS) – SS tasks can’t start until a preceding task starts. However, they can start later. Finish to Finish (FF) – FF tasks can’t end before a preceding task ends. However, they can end later.
- You can display the progress of your project. You can use these charts to keep your team and your sponsors informed of progress. Simply update the chart to show schedule changes and their implications, or use it to communicate that key tasks have been completed.
Do you utilize Gantt charts?
Sources:
https://www.smartdraw.com/gantt-chart/gantt-chart-tips.htm
http://hellofocus.com/what-is-gantt-chart
https://www.wrike.com/blog/project-management-basics-beginners-guide-to-gantt-charts/
https://www.mindtools.com/pages/article/newPPM_03.htm